Data Analysis

2024 Economic Data Highlights from YCharts

I describe YCharts as a massive data lake with a subscription-based interface.

YCharts describes itself, “A powerful, flexible, and time-saving platform empowering growth for both your clients & your business.”

They sent me their 2024 Economic Data deck with the message, “Use these visuals about important investing concepts in your own presentations; share with clients, prospects, colleagues, or followers online!” So here are just a few of the charts contained in it. Here is their .pdf and PowerPoint version.

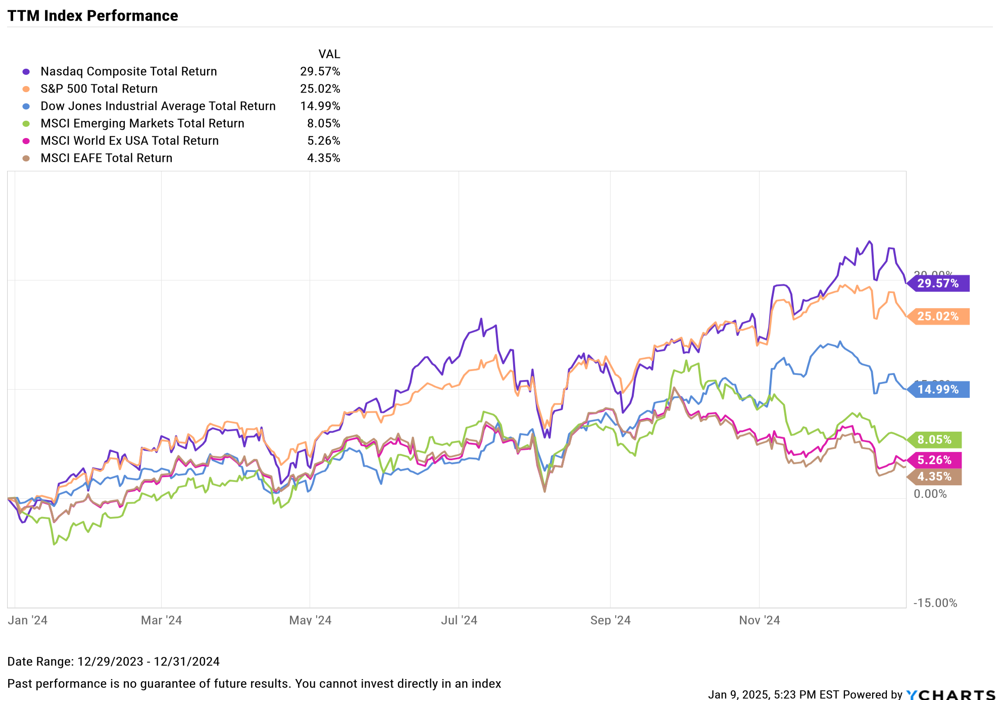
TTM Index Performance, 2024 – Stock investments did really well.

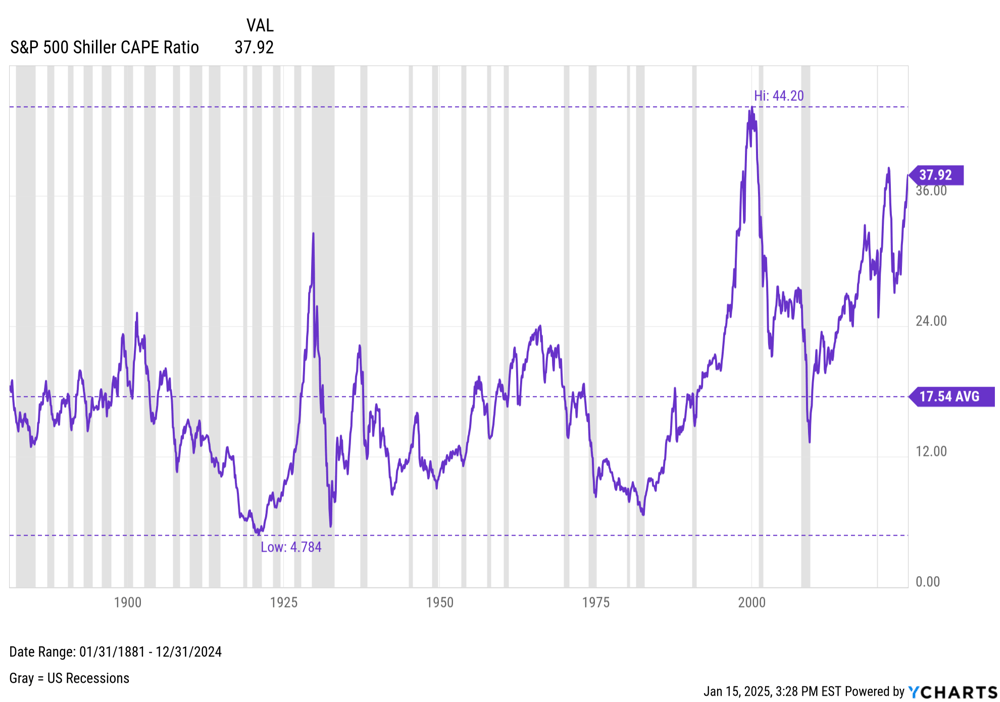
S&P 500 Shiller CAPE Ratio – From across the decades – Stocks are a bit over valued. I would say about 24-26 would be ‘normal’

Inflation and CPI – The post-pandemic inflation was the first run up in several decades.

Employment – The post pandemic boom time for jobs slowed back to ‘normal’, though the US Labor Force Participation Rate never recovered: Generally assumed to be Baby Boomers retiring and people with Long Covid.

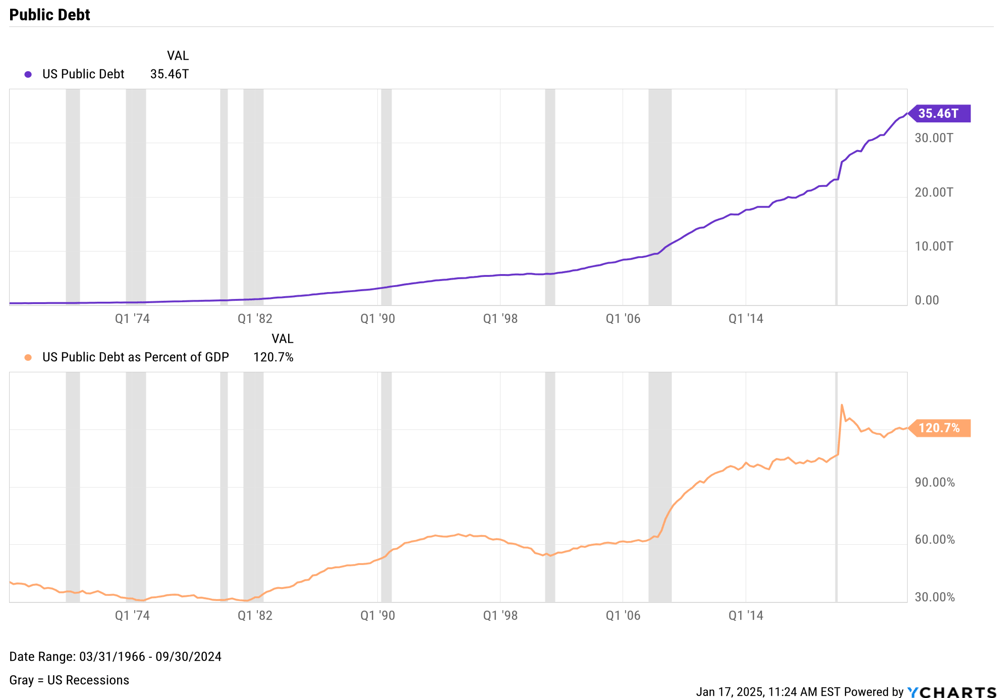
GDP & Public Debt – Two sets of Charts: 1) The US has a tremendous amount of Debt, and 2) Coming out of the 2008-2010 Great Recession moved it toward 100% of US Annual GDP. Coming out of the Pandemic moved it to 120% of US Annual GDP.

Consumers Savings and Credit – Two sets of charts, 1) US Consumers saved money during the Pandemic shutdown, then promptly spent it after the world opened back up. 2) Sales YoY after inflation picked up have been soft and Consumer Sentiment dropped as if there was a recession.

Data Analysis

Sun City Real Estate Sales – January ’23 Update

Data source: pshomes.com – a great collection of homes, for sale and sold, by development in the Coachella Valley

Sun City is one of the largest 55+ communities in the US, located east of Palm Springs with 5,000 condos.

Here’s an update on Sun City sales – with January ’23 sales added

  • What did January ’23 sales look like? (chart 1)
    • Average sold price: $613K
      • Steady at last ~14 month average
      • Number sold: 18
      • Average days on market: 53
      • Average sold price: 3% below list price
    • So average price went back to ‘normal’ even with sales slowing down
  • Let’s limit (normalize) the sales data to the most numerous home size: 2 bed/2 bath condos
  • The data set gives much more stable data over time (
    • Again, with just January ’23 sales
    • Average sold price: $503K
      • Steady at last ~14 month average
      • Number sold: 8
      • Average days on market: 50
  • Looking forward: Number of months to sell inventory
    • 2/15/23 : 5.3 months
      • (96 total condos for sale/18 condos sold in Jan ’23)
    • 1/26/22 : 4.5 months
      • (85 total condos for sale/19 condos sold in Dec ’22)
Data Analysis, Life

US Housing Market – Another Way to Look at Rising Interest Rates

Someone made the comment that home prices have gone down with the increase in mortgage interest rates: people just haven’t realized it.

How does one put numbers towards this statement?

Mortgage interest rates have increased):

  • Around 3.5% for 11 years (mid 2012-year end 2022)
  • Around 6.5% since start of 2022

FRED Chart source:

Note: Portland, Oregon Median House Value: $555K in March, 2021

Standard way to present increasing mortgage interest rates:

  • A $500K home, 30-year mortgage, 100% down (second chart)
    • at 3.5% monthly payment = $2,245
    • at 6.5% monthly payment = $3,327
  • Net: Buyer needs to find more money for monthly payment

Closer to the truth: a home buyer has talked to a banker prior to purchase and has a maximum monthly payment in hand.

How has the home purchase amount changed with a set monthly payment?

A $2,200 monthly payment, a buyer can purchase:

  • With 3.5% interest, purchases a $500K home
  • With 6.5% interest, purchases a $355K home

So this 3.0 point rise in mortgage interest rates, lowers the home value that can be purchased by 29% with all other variables around a home purchases staying fixed. This is the point the commentator made regarding lowering home values. Most people cannot simply increase their monthly payment to purchase a home.

Data Analysis

Sun City Real Estate Sales – Last Two Years

Let’s look at Sun City – one of the largest 55+ communities in the US, located east of Palm Springs with 5,000 condos.

  • NET:
    • Prices increased across 2021 by 32%
      • 1QTR21 average $439K
      • 4QTR21 average $581K
    • Then held steady across 2022 at about $600K
      • Perhaps average getting soft, Nov-Dec ’22
  • Effects from Fed raising interest rates?
    • Perhaps a slow developing change
    • Year prior to July 1, ’22 compared to July – Dec ’22
      • Condos sold/month down 50%
        • 31 homes to 22 homes
      • Average days on Market up 50%
        • 28 days to 45 days
    • Prices largely held steady until Nov/Dec ’22
  • How do sales in this community differ from the norm?
    • 55+ Community, strong HOA
    • People purchasing not dependent on a job
    • Likely based on ability to sell prior home
    • Likely to pay cash rather than mortgage
    • Historically, more sales in snowbird season (winter) than in summer
Data Analysis, Life

My “Coronavirus Overview”

We see many great articles about specific topics about the coronavirus situation. I was having trouble fitting all the details together to form an overview of the situation I could understand. So I researched, and then put together this video.

  • Combining the initial “keep the peak down” chart
  • John Hopkins University’s great work on tracking case information
    • US/Other countries & Oregon/Other states
  • Timelines over the next year
  • Some components of the situation

Hopefully, you will find the video helpful. I had a lot of fun making it!