
I’m taking a EDx course in conjunction with the Portland Python Pirates group. The best of both worlds – an on-line learning with a study group of other local people. Stay tuned!

I’m taking a EDx course in conjunction with the Portland Python Pirates group. The best of both worlds – an on-line learning with a study group of other local people. Stay tuned!
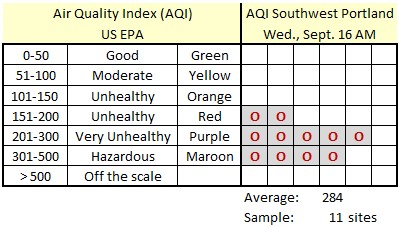
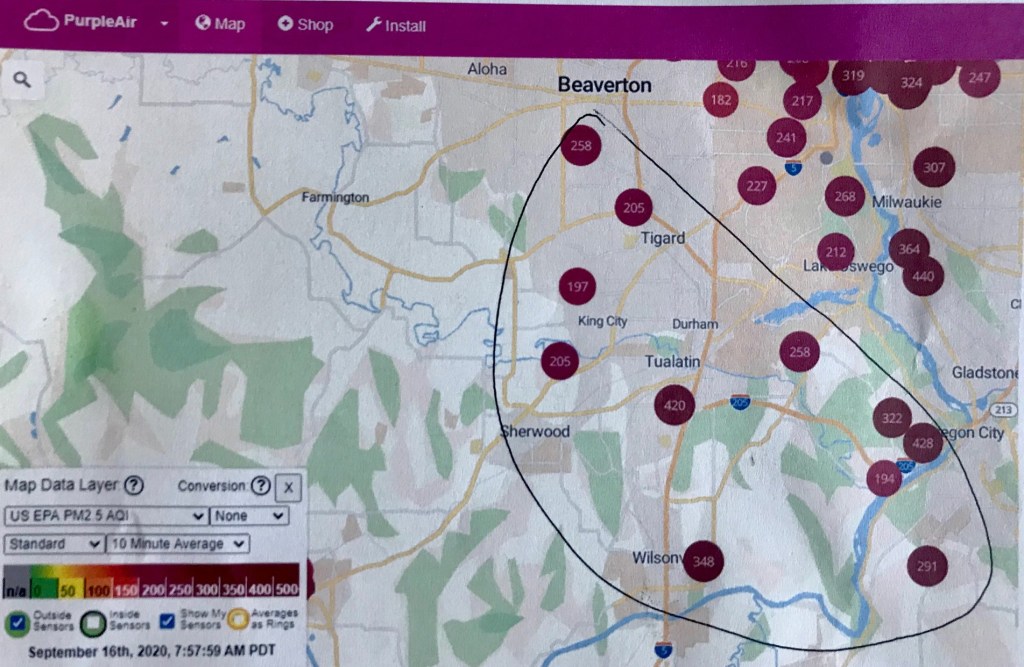
The air quality around Portland with numerous nearby fires was between Very Unhealthy and Hazardous using the US EPA AQI scale.
Which was quickly confirmed by stepping outside.
Here is my third presentation in the coronavirus series, where I focus on and summarize six aspects of the situation:
Leading to my conclusion:
We see many great articles about specific topics about the coronavirus situation. I was having trouble fitting all the details together to form an overview of the situation I could understand. So I researched, and then put together this video.
Hopefully, you will find the video helpful. I had a lot of fun making it!
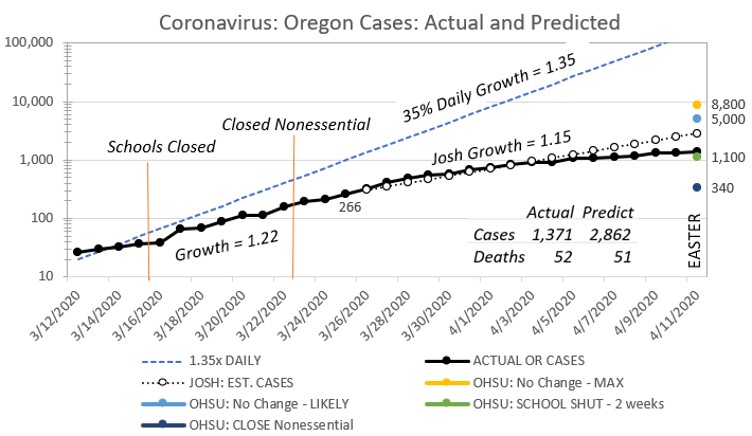
In late March there was a lot of talk about will we open the country on Easter? How many people will have the virus then?
I researched and estimated how many people in Oregon would test positive for coronavirus and how many would die by Easter. Healthcare stats are a bit different than modeling future sales and capacity planning! (See my blog on 3/26 for the initial information.) As Easter was yesterday, I revisited my projections against actual.
NET:
As was reported this morning by CNN – another 6.648M Americans are newly unemployed. My mind quickly went to, “What is the updated unemployment percentage?” As the newscast did not mention this number.
Assumptions in the approximation:


In the news stories yesterday – we were all shocked at the 3.283M Americans newly unemployed. My mind quickly went to, “What is the updated unemployment percentage?” As the newscasts did not mention this number.
The federal government doesn’t calculate it weekly, just monthly.
So I approximated it at 5.5%.
Assumptions in the approximation:

Sources:
https://www.dol.gov/ui/data.pdf (yellow highlighted number)
https://www.bls.gov/news.release/empsit.a.htm (blue highlighted numbers)
There is a lot of information flying around about Coronavirus, so I decided to dig into the data stories. Net:
YouTube video: Coronavirus Review & Update


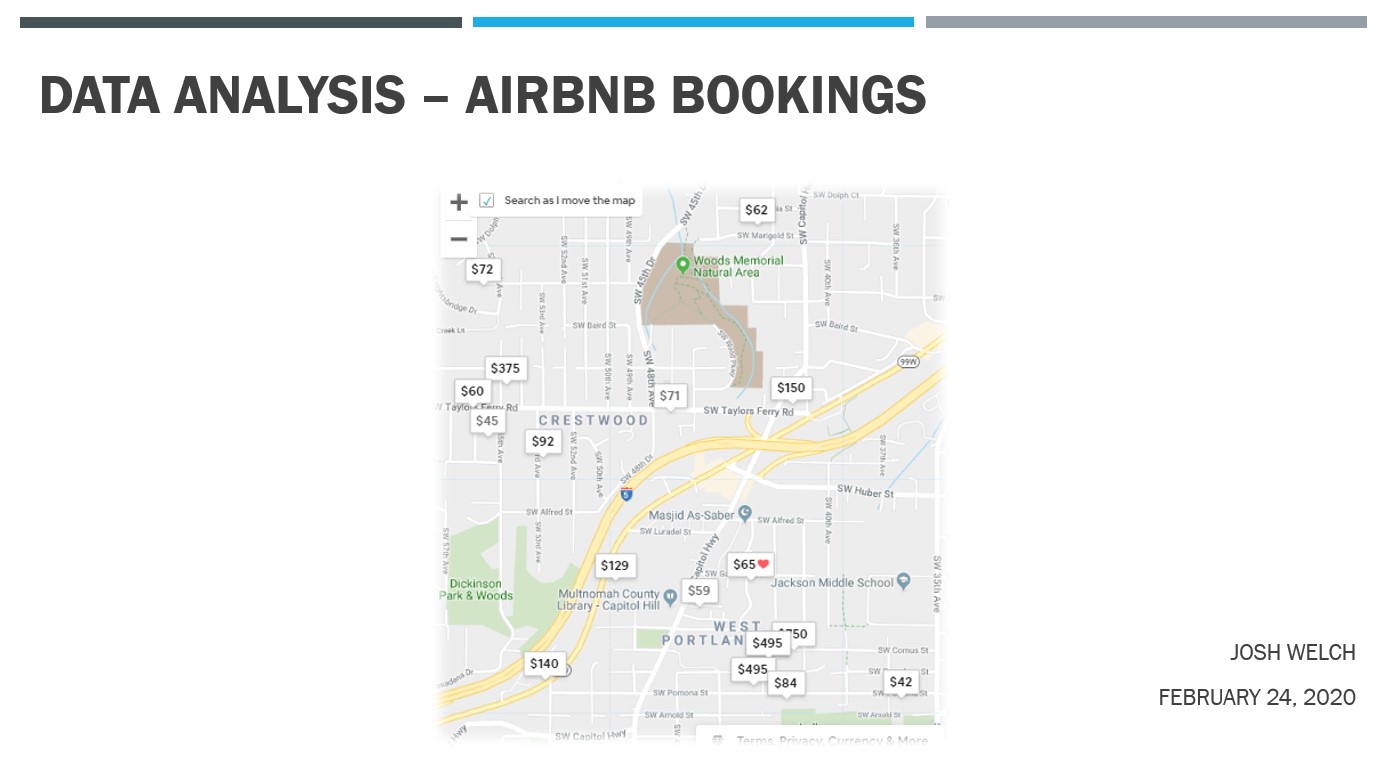
Our Airbnb bookings in early February seemed a little less than usual for mid-winter. So I compared our bookings for February and March to the Airbnb’s around us.
Net: We’re right in the middle of pack.
Click on the graphic below to my telling of this story on YouTube.
Sometimes I geek out on charts… like this over-done one by Wine Spectator.
Basic Conclusions
What does it say to me?

